Resources
Filter results
AdditionSubtractionTimes TablesMultiplicationDivisionNumbers and Place ValueRapid Recall Number SkillsQuick 10 - MathematicsRevision/Exam Prep (Maths)Two Step Problem SolvingFractionsDecimalsMoney and Financial MattersPatterns and AlgebraData, Graphs and StatisticsChance and probabilityConverting between units (time, length, mass, volume)TimeLengthAreaMassVolumeAnglesTwo-dimensional shapesThree-dimensional objectsLocation and TransformationMathematics RevisionAssessments Assessments - Upper primaryAssessments - Pre-primaryAssessments - Lower primaryExtendPrintable WorksheetsHundreds ChartTeaching ResourcesTimes Tables (only interactives)Class game - Number GuessTimes Tables (only interactives)
AdditionSubtractionTimes TablesMultiplicationDivisionNumbers and Place ValueRapid Recall Number SkillsQuick 10 - MathematicsRevision/Exam Prep (Maths)Two Step Problem SolvingFractionsDecimalsMoney and Financial Matters
Data, Graphs and Statistics
Data, Graphs and Statistics
Kinder-
Data - less or more
For students
-
- Data - less or more
- Practice
-
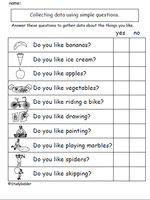
- Answer yes/no questions to collect data
-
Many ways to sort
For students
-
- Many ways to sort
- Practice
-
Data, Graphs and Statistics
Grade 1-
Two way sorts
For students
-
- Two way sorts
- Practice
-
-
Choose simple questions to gather responses
For students
-
Data - reading charts
For students
-
- Data - reading charts
- Practice
-
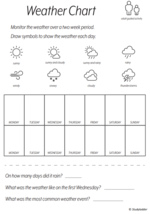
- Weather Chart
- Printable
-
-
Picture graphs
For students
-
- Picture graphs
- Tutorial
-
- Picture graphs
- Practice
-
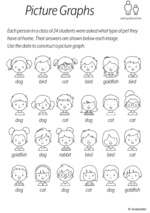
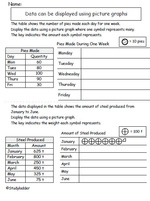
- Constructing picture graphs
- Printable
-
-
Interpret data presented using drawings and symbols
For students
-
- Interpret data as drawings
- Practice
For teachers
-
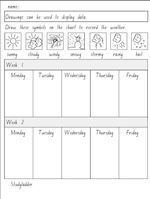
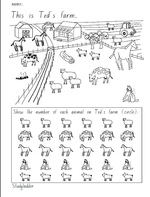
- Display data using objects and drawings
- Printable
-
- Display data using objects and drawings
- Printable
-
Data, Graphs and Statistics
Grade 2-
Interpret data presented in a table
For students
-
- Data tables
- Practice
-
- Reading tables.
- Practice
For teachers
-
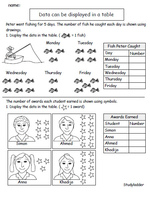
- Display data in a table
- Printable
-
-
Picture graphs.
For students
-
- Picture graphs
- Tutorial
-
- Picture graphs.
- Practice
-
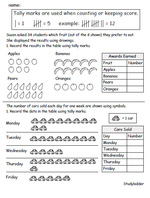
- Interpret data presented with tally marks
-
Interpret data presented in lists
For students
-
- Interpret data in lists
- Practice
-
-
Identify a question of interest based on one categorical variable.
For students
Data, Graphs and Statistics
Grade 3-
Collecting Data
For students
-
- Collecting Data
- Practice
-
-
Answer questions related to the results of collecting data
For students
-
Column graphs
For students
-
- Column graphs
- Tutorial
-
- Column graphs
- Practice
-
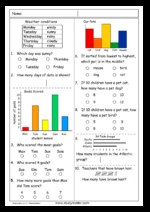
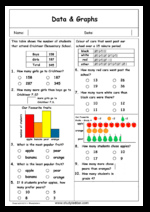
- Interpreting Column Graphs - 3
- Practice
-
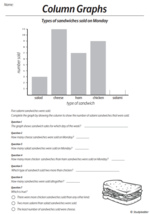
- Reading column graphs
- Printable
For teachers
-
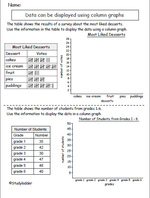
- Display data using a simple column graph
- Printable
-
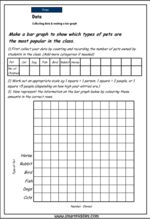
- Collecting data and making a bar graph
- Printable
-
- Data
- Printable
-
- Data
- Printable
-
- Data Problem Solving
- Printable
-
- Data Problem Solving
- Printable
-
-
Reading tables.
For students
-
- Reading tables.
- Practice
-
-
Interpret data presented using picture graphs.
For students
-
- Data - picture graphs
- Practice
-
- Picture graphs.
- Practice
For teachers
-
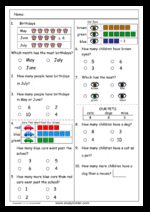
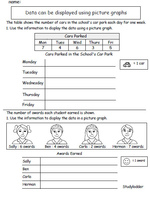
- Display data using picture graphs
- Printable
-
-
Length data - inches
For students
-
- Length data - inches
- Practice
-
- Data (extension)
Data, Graphs and Statistics
Grade 4-
Use surveys to collect data
For students
-
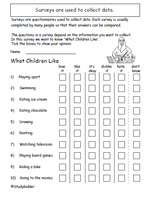
- Surveys to collect data
- Printable
-
-
Reading tables.
For students
-
- Reading tables
- Tutorial
-
- Reading tables.
- Practice
-
- Two way tables
- Practice
-
-
Interpret data using column graphs
For students
-
- Interpreting column graphs
- Tutorial
-
- Interpreting column graphs - 4
- Practice
-
- Graphs
- Practice
For teachers
-
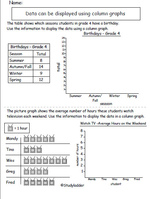
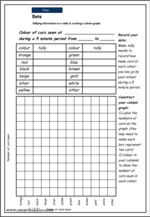
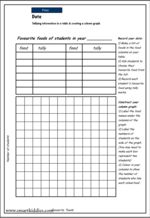
- Display data using column graphs
- Printable
-
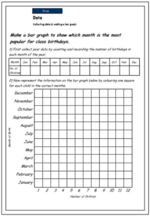
- Collecting data and creating a bar graph
- Printable
-
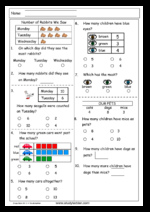
- Picture graphs where one symbol represents many
-
Reading a line plot - fractions of an inch
For students
- Data (extension)
Data, Graphs and Statistics
Grade 5-
Tables and spreadsheets
For students
-
- Reading tables.
- Practice
-
- Interpret a spreadsheet
- Practice
-
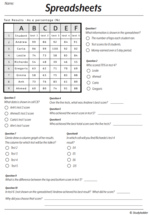
- Spreadsheets
- Printable
-
-
Picture Graphs.
For students
-
- Picture Graphs.
- Practice
-
-
Pie graphs
For students
-
- Pie Graphs
- Tutorial
-
- Graphs
- Practice
-
- Interpreting a pie graph
- Practice
-
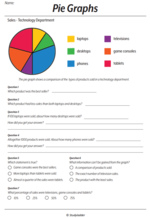
- Reading pie graphs
- Printable
-
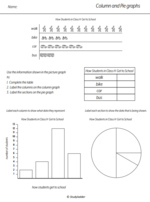
- Column and pie graphs
- Printable
-
-
Column graphs
For students
-
- Interpreting column graphs - 5
- Practice
-
- Column graphs.
- Practice
-
-
Line graphs
For students
-
- Line graph.
- Practice
-
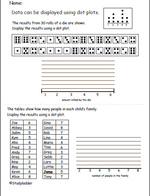
- Dot plots
- Data (extension)
Data, Graphs and Statistics
Grade 6-
Reading tables.
For students
-
- Reading tables.
- Practice
-
-
Column graphs
For students
-
- Column graphs.
- Practice
-
- Interpreting column graphs - 6
- Practice
-
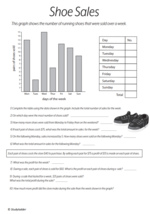
- Column Graph (shoe sales)
- Printable
For teachers
-
- Data Problem Solving
- Printable
-
-
Dot plots
For students
-
- Interpret a dot plot
- Practice
-
-
Line graphs
For students
-
- Line graphs
- Practice
-
- Line graphs.
- Practice
-
-
Pie graphs
For students
-
- Interpreting pie graphs
- Practice
-
- Interpret a pie graph
- Practice
For teachers
-
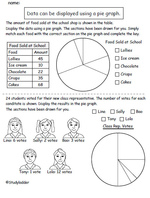
- Display data using a pie graph
- Printable
-
- Data (extension)


